| Structure Identification: |
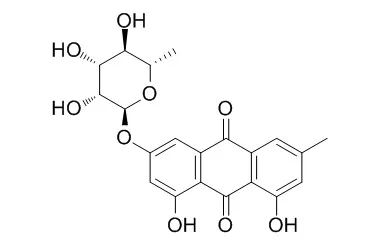
| Magnetic Resonance in Chemistry, 1998, 36(10):769-772. | | Assignment of the 1H and 13C NMR spectra of anthraquinone glycosides from Rhamnus frangula.[Reference: WebLink] | 1H and 13C NMR chemical shifts are reported for five anthraquinone glycosides from Rhamnus frangula (Alder Buckthorn).
METHODS AND RESULTS:
The investigation utilized data obtained by a variety of 1D and 2D NMR techniques such as homodecoupling, NOE, J‐modulated spin‐echo, COSY, HSC and COLOC. Assignments were made for Frangulin A and frangulin B and glucoFrangulin A and B. A further compound previously thought to be a glycoside of emodin is shown to be physcion‐8‐O‐β‐D‐glucoside. | | Planta Med 2013; 79 - PK33. | | New HPLC – method to determine Frangulin A and B as well as Glucofrangulin A and B in Frangulae cortex.[Reference: WebLink] | The current monograph in the European Pharmacopeia for Frangulae cortex describes a photometric assay based on an adapted bornträger reaction to determine hydroxyanthracene glycosides, calculated as frangulin B. The method is time consuming, unspecific for frangulines and the precision is not adequate for a modern assay. The photometric method shall therefore be replaced by a modern HPLC-method. There is no HPLC method published in the literature that allows the determination of Frangulin A/frangulin B and glucoFrangulin A/glucofrangulin B in Frangulae cortex.
METHODS AND RESULTS:
About 300 mg of freshly milled drug are extracted for 15 min with ultrasound. The extraction solution consists of acetonitrile/water 50:50 v/v and 2 g/L NaHCO3. A conventional RP C18 Nucleodur (4 mm x 125 mm), 3 µm was used as stationary phase. Mobile phase A consists of water (pH of 2.0, adjusted with phosphoric acid). Mobile phase B consists acetonitrile/methanol 20:80 v/v. The flow rate is 1.0 mL/min, the detection wavelength 435nm, the column temperature is 50 °C, and the injection volume 20µL. The gradient is shown in table 1.
CONCLUSIONS:
The mobile phase separates the four frangulins sufficiently. Results of several samples will be presented on the poster. A chromatogram from a Frangulae cortex sample is shown in figure 1. |
|



 Cell. 2018 Jan 11;172(1-2):249-261.e12. doi: 10.1016/j.cell.2017.12.019.IF=36.216(2019)
 Cell Metab. 2020 Mar 3;31(3):534-548.e5. doi: 10.1016/j.cmet.2020.01.002.IF=22.415(2019)
 Mol Cell. 2017 Nov 16;68(4):673-685.e6. doi: 10.1016/j.molcel.2017.10.022.IF=14.548(2019)